Where Americans are moving.
Millions of Americans move every year. See where they are heading, what they are leaving and what they earn, for the whole country or any one place, so you know what a city is gaining and who your new neighbors are likely to be.
What the data says
The latest IRS year, 2022 to 2023.
- Texas gained the most people from other states: about 112,000 more moved in than out, and the most came from California.
- California lost the most: about 201,000 more people left for other states than arrived, most often for Texas.
- The busiest move between two states was California to Texas: 82,481 people in one year.
- 6,590,871 people moved to a different state in 2022 to 2023, 1% more than in 2017 to 2018.
- In 296 of 597 busy counties, the households moving in earn more than the ones moving out.
- Among metro areas, Dallas gained the most people from the rest of the country: about 39,000 more moved in than out. New York lost the most, about 174,000.
- For its size, Wildwood grew fastest from moves: +45.5 people for every 1,000 who live there.
- The busiest move between two metro areas was Los Angeles to Riverside: 78,209 people in one year.
Explore the map
Switch between states, metro areas and counties. Click one to see its biggest moves. Pick a second place to compare the two. Filter by distance or by movers' household income, and press Play to watch every year.
Look up a city
Get a full report for any city: where its newcomers come from, where people leave for, and how their incomes compare.
The busiest moves between states
The 15 biggest one-way moves in 2022 to 2023. The gray number is how many went the other way.
Who gained and who lost
People gained or lost to other states for every 1,000 residents on tax returns, 2022 to 2023. Teal bars gained people. Orange bars lost them. The number in parentheses is people.
Moves over time
How many people moved to a different state each year. The IRS publishes each year about two years later.
For one state, or a pair of states, year by year, click it on the map above.
Where the money moves
Average household income on the tax returns of people moving in, minus people moving out, 2022 to 2023. A teal bar means newcomers earn more than the people leaving.
Newcomers out-earn leavers the most
Leavers out-earn newcomers the most
Income is adjusted gross income per tax return, which covers everyone on the return. In 22 of 51 states, newcomers earn more than leavers. Newcomers to Florida average $121,228.
Every state
Moves to and from other states in 2022 to 2023. Click a heading to sort, or download the whole table.
| Texas | 553,369 | 440,888 | +112,481 | +4.9 | $83,863 | $81,153 | 14,933 |
| Florida | 605,238 | 493,496 | +111,742 | +6.6 | $121,228 | $75,964 | 18,279 |
| North Carolina | 295,243 | 226,135 | +69,108 | +8.5 | $80,145 | $74,371 | 6,106 |
| South Carolina | 178,163 | 119,061 | +59,102 | +14.7 | $88,208 | $66,638 | 2,489 |
| Tennessee | 198,430 | 155,531 | +42,899 | +7.9 | $79,460 | $70,207 | 1,891 |
| Georgia | 265,330 | 229,794 | +35,536 | +4.5 | $70,114 | $72,368 | 4,987 |
| Arizona | 202,429 | 175,302 | +27,127 | +4.8 | $87,307 | $75,561 | 3,208 |
| Alabama | 102,902 | 86,565 | +16,337 | +4.5 | $66,670 | $63,927 | 1,658 |
| Idaho | 66,095 | 53,356 | +12,739 | +8.1 | $80,944 | $64,130 | 786 |
| Oklahoma | 85,394 | 72,805 | +12,589 | +4.3 | $58,984 | $60,452 | 1,541 |
| Nevada | 111,121 | 99,563 | +11,558 | +4.6 | $87,290 | $74,822 | 2,069 |
| Arkansas | 68,449 | 57,238 | +11,211 | +5.0 | $62,968 | $59,308 | 700 |
| Missouri | 124,978 | 116,139 | +8,839 | +1.9 | $65,855 | $71,540 | 1,639 |
| Delaware | 35,759 | 27,956 | +7,803 | +9.7 | $88,167 | $76,297 | 488 |
| Colorado | 187,420 | 180,132 | +7,288 | +1.6 | $82,455 | $84,460 | 4,080 |
| Maine | 31,675 | 25,178 | +6,497 | +5.9 | $85,089 | $73,852 | 480 |
| Kentucky | 86,522 | 80,661 | +5,861 | +1.7 | $60,478 | $65,679 | 1,127 |
| Montana | 35,226 | 29,894 | +5,332 | +6.0 | $78,915 | $64,963 | 408 |
| Indiana | 121,307 | 116,470 | +4,837 | +0.9 | $64,288 | $67,736 | 1,162 |
| New Hampshire | 40,918 | 36,723 | +4,195 | +3.6 | $108,993 | $88,031 | 588 |
| West Virginia | 36,521 | 33,384 | +3,137 | +2.4 | $58,478 | $60,437 | 227 |
| Wisconsin | 89,800 | 87,047 | +2,753 | +0.6 | $72,166 | $74,261 | 1,396 |
| South Dakota | 26,881 | 24,469 | +2,412 | +3.2 | $73,753 | $63,746 | 390 |
| Utah | 80,211 | 79,014 | +1,197 | +0.4 | $80,068 | $75,046 | 1,383 |
| Wyoming | 22,038 | 21,663 | +375 | +0.8 | $79,611 | $69,134 | 276 |
| Vermont | 16,939 | 16,855 | +84 | +0.2 | $81,842 | $71,860 | 243 |
| Washington | 192,628 | 192,657 | −29 | 0.0 | $90,288 | $101,367 | 6,184 |
| Virginia | 230,220 | 230,262 | −42 | 0.0 | $82,948 | $89,885 | 12,303 |
| North Dakota | 23,095 | 23,852 | −757 | −1.2 | $54,547 | $64,678 | 517 |
| Rhode Island | 27,055 | 28,123 | −1,068 | −1.2 | $82,404 | $79,463 | 455 |
| Iowa | 57,011 | 58,478 | −1,467 | −0.6 | $61,586 | $64,795 | 636 |
| Nebraska | 38,081 | 39,983 | −1,902 | −1.2 | $59,864 | $66,424 | 729 |
| New Mexico | 51,817 | 53,741 | −1,924 | −1.2 | $65,909 | $68,473 | 1,616 |
| District of Columbia | 41,301 | 43,869 | −2,568 | −5.3 | $86,659 | $117,226 | 1,107 |
| Mississippi | 56,470 | 59,612 | −3,142 | −1.5 | $56,877 | $53,459 | 766 |
| Kansas | 70,469 | 74,517 | −4,048 | −1.7 | $64,714 | $68,145 | 1,407 |
| Alaska | 25,599 | 29,748 | −4,149 | −7.2 | $63,208 | $70,755 | 1,022 |
| Connecticut | 76,966 | 81,733 | −4,767 | −1.6 | $110,945 | $107,282 | 1,513 |
| Oregon | 98,688 | 103,462 | −4,774 | −1.5 | $74,875 | $82,155 | 1,286 |
| Ohio | 155,049 | 161,361 | −6,312 | −0.7 | $67,188 | $77,981 | 2,747 |
| Hawaii | 45,031 | 51,856 | −6,825 | −6.0 | $78,183 | $70,932 | 3,054 |
| Minnesota | 84,839 | 92,400 | −7,561 | −1.6 | $70,560 | $89,202 | 1,361 |
| Michigan | 119,409 | 127,851 | −8,442 | −1.1 | $74,299 | $78,193 | 2,386 |
| Pennsylvania | 199,298 | 214,178 | −14,880 | −1.4 | $76,192 | $85,507 | 3,840 |
| Louisiana | 65,960 | 83,293 | −17,333 | −5.3 | $58,224 | $62,595 | 1,164 |
| Maryland | 135,223 | 155,335 | −20,112 | −4.2 | $80,923 | $88,442 | 3,967 |
| Massachusetts | 116,816 | 145,183 | −28,367 | −5.2 | $90,442 | $116,360 | 3,118 |
| New Jersey | 173,739 | 203,610 | −29,871 | −4.0 | $102,349 | $107,091 | 3,497 |
| Illinois | 179,622 | 233,804 | −54,182 | −5.4 | $78,784 | $104,432 | 3,829 |
| New York | 268,427 | 426,397 | −157,970 | −10.3 | $94,532 | $106,892 | 7,585 |
| California | 389,700 | 590,247 | −200,547 | −6.5 | $95,714 | $103,236 | 17,144 |
Every move between two states
All 2,544 state-to-state moves in 2022 to 2023, with the number going the other way and the net. Filter by a state's name, sort any column, or download the table.
Loading every move between states…
Metro areas
Moves between a metro area and the rest of the country in 2022 to 2023. Moves between counties of the same metro count as staying put, and moves abroad are left out. On the map above, choose Metro areas to explore them.
The busiest moves between metro areas
The gray number is how many went the other way. Click a pair to see it on the map.
Gaining the most people
- Dallas, TX +39,109
- Houston, TX +25,002
- Tampa, FL +20,425
- Charlotte, NC +20,082
- Phoenix, AZ +18,348
- Jacksonville, FL +18,304
- Lakeland, FL +18,208
- Austin, TX +17,007
- San Antonio, TX +16,891
- North Port, FL +14,498
Losing the most people
- New York, NY −174,207
- Los Angeles, CA −106,283
- Miami, FL −54,391
- Chicago, IL −45,241
- San Francisco, CA −36,367
- Washington, DC −28,672
- Boston, MA −24,219
- San Jose, CA −20,130
- San Diego, CA −18,725
- Philadelphia, PA −14,339
Every metro area
| Dallas, TX | 243,627 | 204,518 | +39,109 | +6.0 | $86,488 | $83,365 |
| Houston, TX | 183,634 | 158,632 | +25,002 | +4.3 | $78,893 | $86,392 |
| Tampa, FL | 135,937 | 115,512 | +20,425 | +8.0 | $84,362 | $68,096 |
| Charlotte, NC | 102,284 | 82,202 | +20,082 | +9.1 | $81,666 | $81,616 |
| Phoenix, AZ | 155,333 | 136,985 | +18,348 | +4.7 | $89,377 | $78,275 |
| Jacksonville, FL | 77,297 | 58,993 | +18,304 | +13.6 | $89,034 | $69,519 |
| Lakeland, FL | 56,660 | 38,452 | +18,208 | +29.4 | $56,694 | $53,479 |
| Austin, TX | 112,105 | 95,098 | +17,007 | +8.9 | $100,732 | $99,199 |
| San Antonio, TX | 97,015 | 80,124 | +16,891 | +7.9 | $70,514 | $69,954 |
| North Port, FL | 52,715 | 38,217 | +14,498 | +21.0 | $138,563 | $81,356 |
| Nashville, TN | 83,091 | 69,384 | +13,707 | +8.1 | $87,637 | $77,025 |
| Raleigh, NC | 73,689 | 60,200 | +13,489 | +11.0 | $83,338 | $81,966 |
| Deltona, FL | 41,843 | 29,475 | +12,368 | +22.6 | $78,730 | $58,096 |
| Atlanta, GA | 186,950 | 174,894 | +12,056 | +2.5 | $72,552 | $77,974 |
| Port St. Lucie, FL | 34,992 | 23,488 | +11,504 | +27.5 | $98,321 | $70,597 |
| Ocala, FL | 28,352 | 17,042 | +11,310 | +37.4 | $65,836 | $54,095 |
| Myrtle Beach, SC | 25,782 | 14,550 | +11,232 | +37.2 | $82,989 | $55,207 |
| Greenville, SC | 39,670 | 29,288 | +10,382 | +13.6 | $75,751 | $63,674 |
| Charleston, SC | 42,509 | 32,275 | +10,234 | +15.7 | $96,571 | $75,020 |
| Palm Bay, FL | 34,866 | 24,742 | +10,124 | +20.0 | $81,139 | $68,216 |
| Wilmington, NC | 27,747 | 17,702 | +10,045 | +28.1 | $95,534 | $67,202 |
| Knoxville, TN | 35,673 | 26,889 | +8,784 | +11.8 | $76,515 | $64,469 |
| Las Vegas, NV | 86,560 | 77,823 | +8,737 | +4.8 | $83,844 | $70,788 |
| Boise City, ID | 33,464 | 25,065 | +8,399 | +12.4 | $81,907 | $68,980 |
| Orlando, FL | 127,320 | 119,132 | +8,188 | +3.7 | $71,627 | $61,983 |
Every move between two metro areas
Loading every move between metro areas…
Summed from IRS county-to-county flows. County flows under 20 returns are not published, so small metro pairs are missing.
Every county
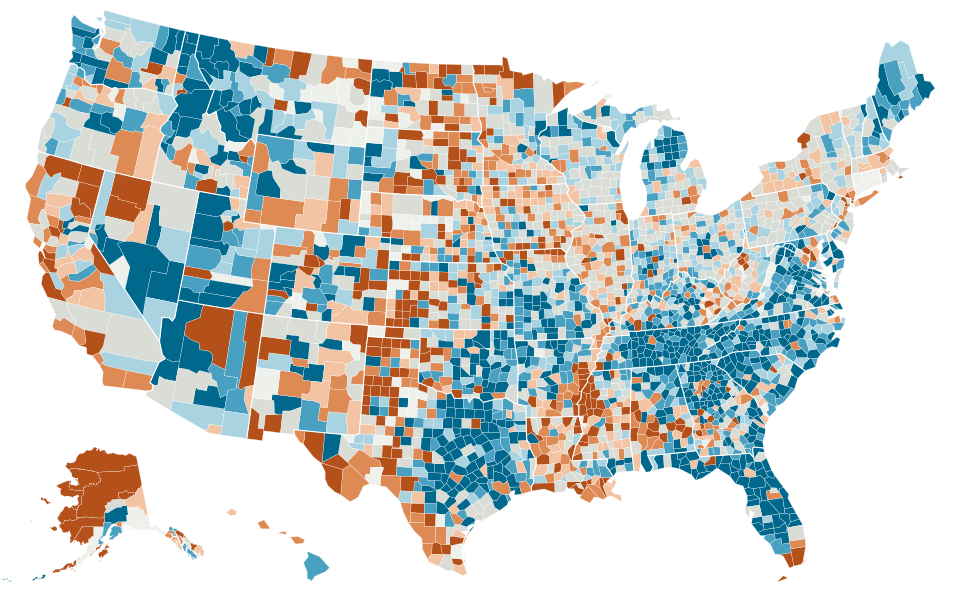
For every 1,000 people in a county who filed taxes (counting their families on the return), how many more moved in than moved out (2022 to 2023). 1,806 of 3,037 counties gained.
Growing fastest from moves
- Liberty County, TX +57.4 per 1,000
- Jackson County, GA +53.2 per 1,000
- Brunswick County, NC +50.2 per 1,000
- Kaufman County, TX +49.0 per 1,000
- Sumter County, FL +45.5 per 1,000
- Flagler County, FL +41.7 per 1,000
- Wise County, TX +41.7 per 1,000
- Comal County, TX +41.2 per 1,000
- St. Johns County, FL +40.5 per 1,000
- Lake County, FL +39.9 per 1,000
Shrinking fastest from moves
- St. Louis city, MO −23.8 per 1,000
- Suffolk County, MA −22.4 per 1,000
- Geary County, KS −22.3 per 1,000
- Kings County, NY −21.0 per 1,000
- Hudson County, NJ −20.3 per 1,000
- Orleans Parish, LA −19.2 per 1,000
- Vernon Parish, LA −18.9 per 1,000
- Miami-Dade County, FL −18.7 per 1,000
- Fairbanks North Star Borough, AK −18.2 per 1,000
- Philadelphia County, PA −17.1 per 1,000
Leaderboards count counties with at least 10,000 people moving in or out.
Loading every county…
Where the numbers come from
The IRS counts people on tax returns who filed from one place one year and a different place the next. It publishes the moves between every pair of states and every pair of counties as SOI migration data; this page uses the 6 most recent years, 2017 to 2018 through 2022 to 2023. People who do not file taxes are not counted, and flows of fewer than 20 returns are not published. Income is adjusted gross income per return. Distances are straight lines between the centers of places. State and county outlines are from the US Census Bureau. How we use it.