Where Americans are moving.
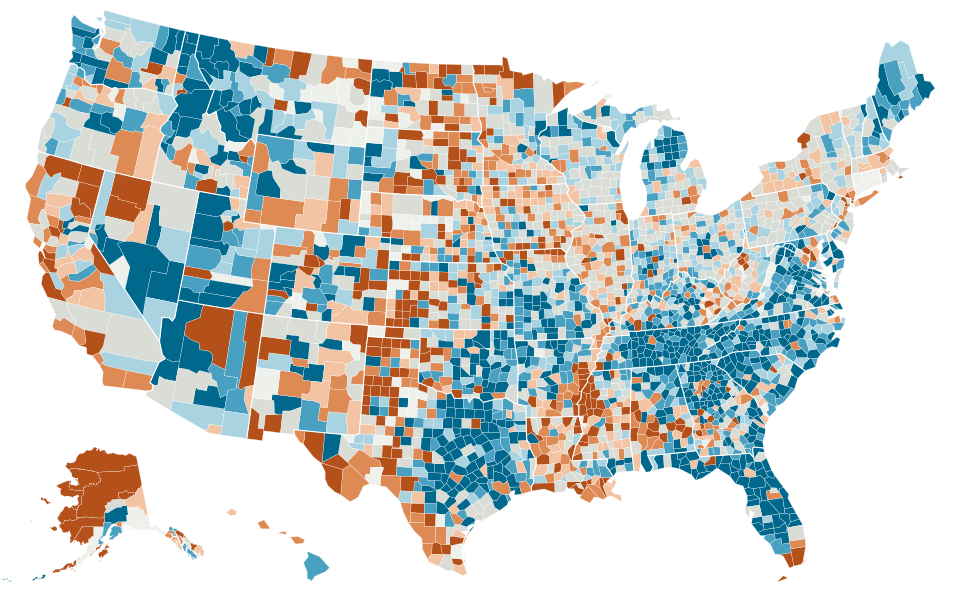
Every year, millions of people move from one county to another. This map shows which counties gain people from moves and which lose them. Pick a city to see exactly where its newcomers come from and where people leave for.
Gaining or losing people to moves
For every 1,000 people in a county who filed taxes (counting their families on the return), how many more moved in than moved out (2022 to 2023). Teal counties gained people. Orange counties lost them. 1,805 of 3,036 counties gained.
The biggest winners and losers
Counties with at least 10,000 people moving in or out. Click one to see its moves.
Growing fastest from moves
- Liberty County, TX +57.4 per 1,000
- Jackson County, GA +53.2 per 1,000
- Brunswick County, NC +50.2 per 1,000
- Kaufman County, TX +49.0 per 1,000
- Sumter County, FL +45.5 per 1,000
- Flagler County, FL +41.7 per 1,000
- Wise County, TX +41.7 per 1,000
- Comal County, TX +41.2 per 1,000
- St. Johns County, FL +40.5 per 1,000
- Lake County, FL +39.9 per 1,000
Shrinking fastest from moves
- Bronx County, NY −29.5 per 1,000
- St. Louis city, MO −23.8 per 1,000
- Suffolk County, MA −22.4 per 1,000
- Geary County, KS −22.3 per 1,000
- Hudson County, NJ −20.3 per 1,000
- Orleans Parish, LA −19.2 per 1,000
- Vernon Parish, LA −18.9 per 1,000
- Miami-Dade County, FL −18.7 per 1,000
- Fairbanks North Star Borough, AK −18.2 per 1,000
- Philadelphia County, PA −17.1 per 1,000
Most people gained
- Montgomery County, TX +18,577
- Polk County, FL +18,556
- Pasco County, FL +18,430
- Collin County, TX +18,388
- Williamson County, TX +14,863
- Denton County, TX +13,794
- Pinal County, AZ +13,700
- Lake County, FL +12,855
- Marion County, FL +11,408
- Horry County, SC +11,230
Most people lost
- Los Angeles County, CA −86,523
- Cook County, IL −42,264
- Miami-Dade County, FL −40,258
- Bronx County, NY −31,100
- Dallas County, TX −29,269
- Orange County, CA −22,420
- Santa Clara County, CA −22,360
- Harris County, TX −21,215
- Alameda County, CA −18,573
- San Diego County, CA −18,212
Where the numbers come from
The IRS counts people on tax returns who filed from one county one year and a different county the next. It publishes the moves between every pair of counties as SOI migration data. People who do not file taxes are not counted, and flows of fewer than 20 returns are not published. County outlines are from the US Census Bureau. How we use it.